


Section One: Creative Testing 2021
Creative Testing 2021: Our Unique Way
Let us set the stage for how and why we have been doing creative testing in a unique way. We test a lot of creative. In fact, we produce and test more than 100,000 videos and images yearly for our clients. We have also performed over 10,000 A/B and multivariate tests on Facebook, Google, TikTok, and Snap.
In addition, we focus on these verticals: gaming, e-commerce, entertainment, automotive, D2C, financial services, and lead generation. When we test, our goal is to compare new concepts versus the winning video (control) to see if the challenger can outperform the champion. Why? If you cannot outperform the best ad in a portfolio, you will lose money running the second or third place ads.
While we have not tested our process beyond the verticals, we have managed over $3 billion in paid social ad spend and want to share what we have learned. Our creative testing process in 2021 is designed to save both time and money by killing losing creatives quickly and to significantly reduce non-converting spend. Our process will also generate both false negatives and false positives. We typically allow our tests to run between 2-7 days to provide enough time to gather data without requiring the capital and time required to reach statistical significance (StatSig). We always run our tests using our software AdRules via the Facebook API. Plus, our insights are specific to the above scenarios, not a representation of how all testing on Facebook’s platform operates. In cases, it is valuable to retain learning without obstructing ad delivery.
To be clear, our process is not the Facebook best practice of running a split test and allowing the algorithm to reach statistical significance (StatSig) which then moves the ad set out of the learning phase and into the optimized phase. The insights we have drawn are specific to the scenarios we outline here. They are not a representation of how all testing on Facebook’s platform operates. In some cases, it is valuable to have old creative retain learning to seamlessly A/B test without obstruct- ing ad delivery.
Creative Testing 2021: Statistical Significance vs Cost-Effective
Let us take a closer look at the cost aspect of creative testing.
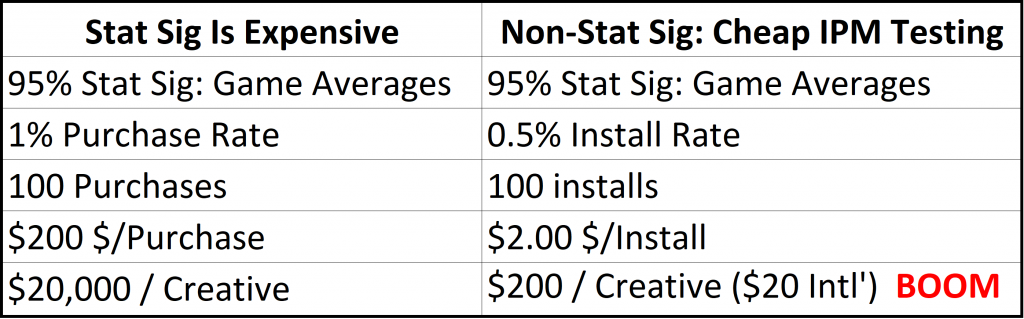
In classic testing, you need a 95% confidence rate to declare a winner, exit the learning phase, and reach StatSig. That’s nice to have, but getting a 95% confidence rate for in-app purchases may end up costing you $20,000 per creative variation.
Why so expensive?
Here is an example scenario: To reach a 95% confidence level, you’ll need about 100 purchases. With a 1% purchase rate (which is typical for gaming apps), and a $200 cost per purchase, you will end up spending $20,000 for each variation in order to accrue enough data for that 95% confidence rate. There are not a lot of advertisers who can afford to spend $20,000 per variation, especially if 95% of new creative fails to beat the control. In this example, with a cost of $20,000 per variation and a 95% failure rate, it would cost $400,000 just to find a new control. That is because we would have to test 20 variations to find the winner, and – as mentioned earlier – testing each variation costs about $20,000.
So, what to do?
To avoid such high testing costs, we move the conversion event we are targeting up, or towards the beginning of the sales funnel. For mobile apps, instead of optimizing for purchases, we optimize for impressions per install (IPM). For web- sites, we would optimize for an impression to top-funnel conversion rate. Again, this is not a Facebook recommended best practice. This is our own methodology, designed to allow advertisers to find new, top-performing creative in the most cost-efficient and reliable way.
IPM Testing Is Cost-Effective
A concern with our process is that ads with high CTRs and high conversion rates for top-funnel events may not be true winners for down-funnel conversions and ROI / ROAS. Although there is a risk of identifying false positives and negatives with this method. But we would rather take that risk than spend the time and expense of optimizing for StatSig bottom-funnel metrics.
To us, it is more efficient to optimize for IPMs vs. purchases. This means you can run tests for less money per variation because you are optimizing towards installs vs purchases. For many advertisers, that alone can make more testing financially viable. For instance, $200 testing cost per variation versus $20,000 testing cost per variation can mean the difference between being able to do a couple of tests versus having an ongoing, robust testing program.
We do not just test a lot of new creative ideas. We also test our creative testing methodology. That might sound a little “meta,” but it is essential for us to validate and challenge our assumptions and results. For example, when we choose a winning ad out of a pack of competing ads. We want to know that we made a good decision.
Because the outcomes of our tests have consequences – sometimes big consequences – we test our testing process. We question our testing methodology and the assumptions that shape it. This is because the outcome of every test shapes our creative strategy going forward. So, making the wrong call on a test of new creative concepts does not just mean we kill the concepts that did not work. Rather, it means our whole creative strategy pivots away from those concepts. If we are wrong, that could have significant consequences.