

Section Three
Creative Testing and Why the Control is So Hard to Beat
High-performance creative is a rare thing for social advertising. In our experience, after spending over $3 billion dollars driving UA across Facebook and Google, usually only one out of twenty ads can beat the “best performing control” (the top ad). In creative testing, if a piece of creative does not outperform the best video, you lose money running it. Losers are killed quickly, and winners are scaled to the moon.
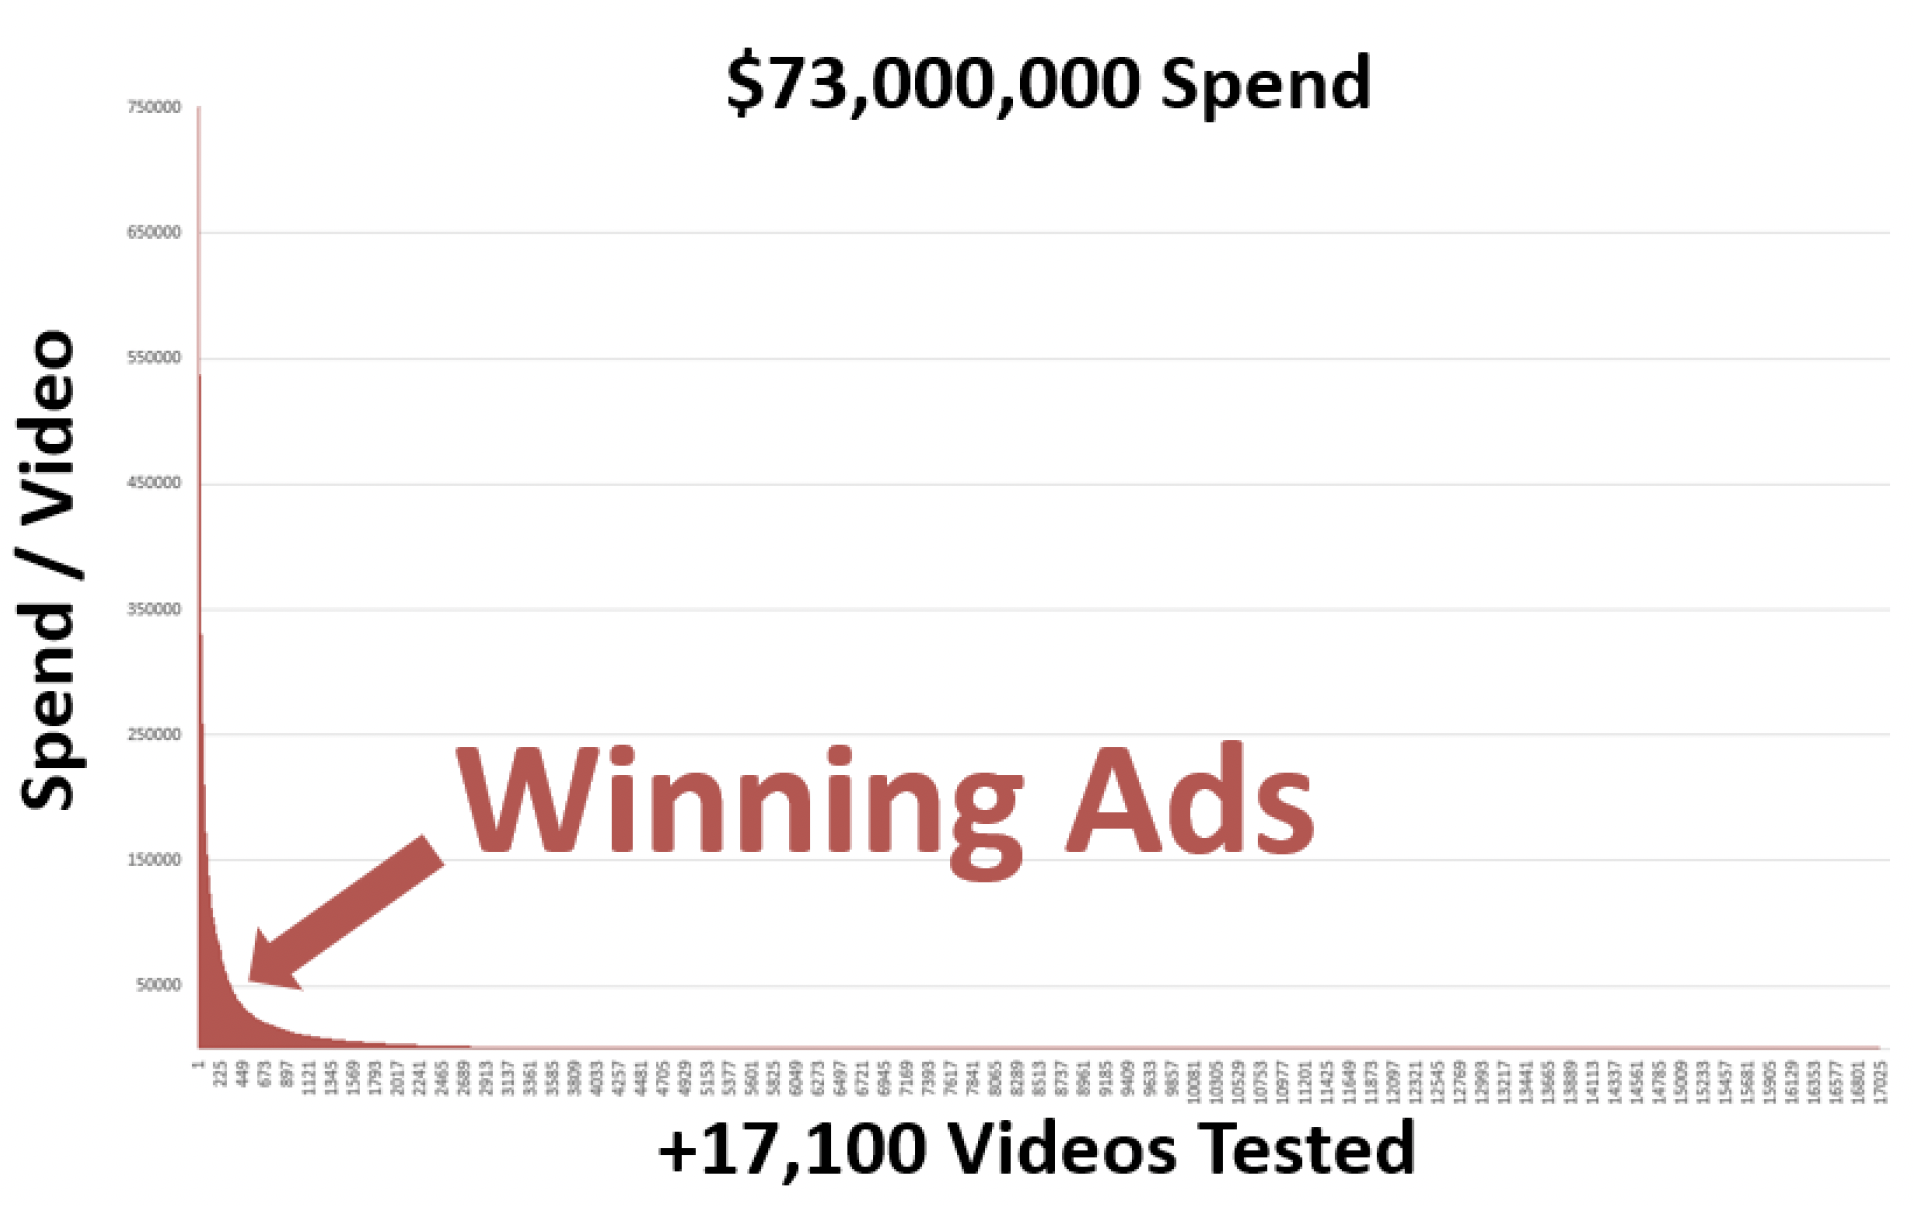
The reality is a vast majority of ads fail. The chart below shows the results of over 17,100 different ads. Spend is distributed based on ad performance. As you can see, out of those 17,000 ads, only a handful drove a majority of the spend.
The high failure rate of most creative shapes creative strategy, budgets, and ad testing methodology. If you can not test ads quickly and affordably, your campaign’s financial performance is likely to suffer from a lot of non-converting spend. But testing alone is not enough. You also must generate enough original creative concepts to fuel testing and uncover winners. Over the years, we have found that 19 out of 20 ads fail (5% success rate), you do not just need one new creative: You need 20 new original ideas or more to sustain performance and scale!
And you need all that new creative fast because creative fatigues quickly. You may need 20 new creative concepts every month, or possibly even every week depending on your ad spend and how your title monetizes (IAA or IAP). The more spend you run through your account, the more likely it is that your ad’s performance will decline.
Creative Testing: Our Unique Way
Let us set the stage for how and why we have been doing creative testing in a unique way. We test a lot of creative. In fact, we produce and test more than 100,000 videos and images yearly for our clients, and we’ve performed over 10,000 A/B and multivariate tests on Facebook and Google.
We focus on these verticals: gaming, e-commerce, entertainment, automotive, D2C, financial services, and lead generation. When we test, our goal is to compare new concepts vs. the winning video (control) to see if the challenger can outperform the champion. Why? If you can not outperform the best ad in a portfolio, you will lose money running the second or third place ads.
While we have not tested our process beyond the verticals, we have managed over $3 billion in paid social ad spend and want to share what we’ve learned. Our testing process has been architected to save both time and money by killing losing creatives quickly and to significantly reduce non converting spend. Our process will generate both false negatives and false positives. We typically allow our tests to run between 2-7 days to provide enough time to gather data without requiring the capital and time required to reach statistical significance (StatSig). We always run our tests using our software AdRules via the Facebook API. Our insights are specific to the above scenarios, not a representation of how all testing on Facebook’s platform operates. In cases, it is valuable to retain learning without obstructing ad delivery.
To be clear, our process is not the Facebook best practice of running a split test and allowing the algorithm to reach statistical significance (StatSig) which then moves the ad set out of the learning phase and into the optimized phase. The insights we have drawn are specific to these scenarios we outline here and are not a representation of how all testing on Facebook’s platform operates. In cases, it is valuable to have old creative retain learning to seamlessly A/B test without obstruct- ing ad delivery.
Statistical Significance vs Cost-Effective Approach
Let us take a closer look at the cost aspect of creative testing.
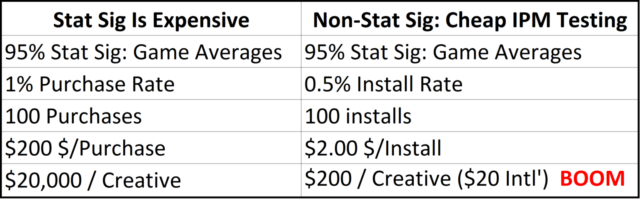
In classic testing, you need a 95% confidence rate to declare a winner, exit the learning phase, and reach StatSig. That’s nice to have but getting a 95% confidence rate for in-app purchases may end up costing you $20,000 per creative variation.
Why so expensive?
As an example, to reach a 95% confidence level, you will need about 100 purchases. With a 1% purchase rate (which is typical for gaming apps), and a $200 cost per purchase, you will end up spending $20,000 for each variation in order to accrue enough data for that 95% confidence rate. There are not a lot of advertisers who can afford to spend $20,000 per variation, especially if 95% of new creative fails to beat the control.
So, what to do?
What we do is move the conversion event we’re targeting for up in the sales funnel. For mobile apps, instead of optimizing for purchases, we optimize for impressions per install (IPM). For web- sites, we would optimize for an impression of the top-funnel conversion rate. Again, this is not a Facebook recommended best practice, this is our own voodoo magic/secret sauce that we’re brewing.
IPM Testing Is Cost-Effective
A concern with our process is that ads with high CTRs and high conversion rates for top-funnel events may not be true winners for down-funnel conversions and ROI / ROAS. But while there is a risk of identifying false positives and negatives with this method, we’d rather take that risk than spend the time and expense of optimizing for StatSig bottom-funnel metrics.
To us, it is more efficient to optimize for IPMs vs. purchases. Most importantly, it means you can run tests for less money per variation because you are optimizing towards installs vs purchases. For many advertisers, that alone can make more testing financially viable. $200 testing cost per variation versus $20,000 testing cost per variation can mean the difference between being able to do a couple of tests versus having an ongoing, robust testing program.
We do not just test a lot of new creative ideas. We also test our creative testing methodology. That might sound a little “meta,” but it’s essential for us to validate and challenge our assumptions and results. When we choose a winning ad out of a pack of competing ads, we’d like to know that we have made a good decision.
Because the outcomes of our tests have consequences – sometimes big consequences – we test our testing process. We question our testing methodology and the assumptions that shape it. When we kill four out of five new concepts because they did not test well, our entire team reacts by killing the losing concepts and pivoting the creative strategy based on those results to try other ideas.
How We’ve Been Testing Creative Until Now
When testing creative we typically would test three to five videos along with a control video using Facebook’s split test feature. We would show these ads to broad or 5-10% LALs (Lookalike) audiences, and restrict distribution to the Facebook newsfeed only, Android only and we would use mobile app install bidding (MAI) to get about 100-250 installs.
If one of those new “contender” ads beat the control video’s IPM or came within 10%-15% of its performance, we would launch those potential new winning videos into the ad sets with the control video and let them fight it out to generate ROAS.
We have seen hints of what we are about to describe across numerous ad accounts and have confirmed with other advertisers that they have seen the same thing. But for purposes of explanation, let’s focus on one client of ours and how their ads performed in recent creative tests.
In the two months, we produced +60 new video concepts for this client. All of them failed to beat the control video’s IPM. This struck us as odd, and it was statistically impossible. We expected to generate a new winner 5% of the time or 1 out of 20 videos – so 3 winners. Since we felt confident in our creative ideas, we decided to look deeper into our testing methods.
The traditional testing methodology includes the idea of testing a testing system or an A/A test. A/A tests are like A/B tests, but instead of testing multiple creatives, you test the same creative in each “slot” of the test.
If your testing system/platform is working as expected, all “variations”, should produce similar results assuming you get close to statistical significance. If your A/A test results are very different, and the testing platform/methodology concludes that one variation or another significantly outperforms or underperforms compared to the other variations, there could be an issue with the testing method or quantity of data gathered.
First A/A test of video creative
Here is how we set up an A/A test to validate our non-standard approach to Facebook testing. The purpose of this test was to understand if Facebook maintains a creative history for the control and thus gives the control a performance boost making it very difficult to beat – if you don’t allow it to exit the learning phase and reach statistical relevance.
We copied the control video four times and added one black pixel in different locations in each of the new “variations.” This allowed us to run what would look like the same video to humans but would be different videos in the eyes of the testing platform. The goal was to get Facebook to assign new hash IDs for each cloned video and then test them all together and observe their IPMs.
These are the ads we ran… except we did not run the hotdog dog; I have replaced the actual ads with cute doges to avoid disclosing the advertiser’s identity. IPMs for each ad in the far right of the image.
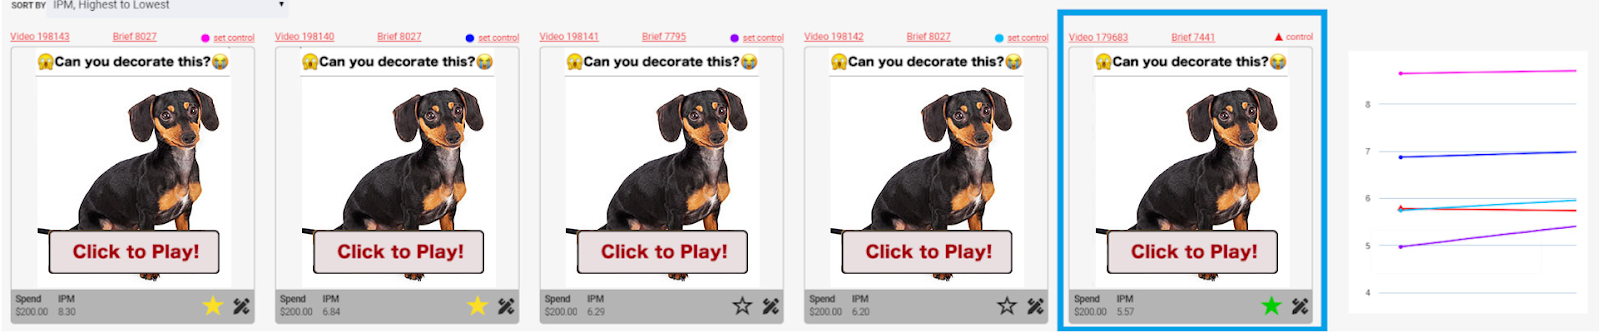
Things to note here:
The far-right ad (in the blue square) is the control.
All the other ads are clones of the control with one black pixel added.
The far-left ad/clone outperformed the control by 149%. As described earlier, a difference like that should not happen. If the platform was truly variation agnostic, BUT – to save money, we did not follow best practices to allow the ad set(s) to exit the learning phase.
We ran this test for only 100 installs. Which is, our standard operating procedure for creative testing.
Once we completed our first test to 100 installs, we paused the campaign to analyze the results. Then we turned the campaign back on to scale up to 500 installs in an effort to get closer to statistical significance. We wanted to see if more data would result in IPM normalization (in other words, if the test results would settle back down to more even performance across the variations). However, the results of the second test remained the same. Note: the ad set(s) did not exit the learning phase and we did not follow Facebook’s best practice.
The results of this first test, while not statistically significant, were surprisingly enough to merit additional tests. So, we tested on!
Second A/A test of video creative
For our second test, we ran the six videos shown below. Four of them were controls with different headers; two of them were new concepts that were very similar to the control. Again, we didn’t run the hotdog dogs; they have been inserted to protect the advertiser’s identity and to offer you cuteness!
The IPMs for all ads ranged between 7-11 – even the new ads that did not share a thumbnail with the control. IPMs for each ad in the far right of the image.
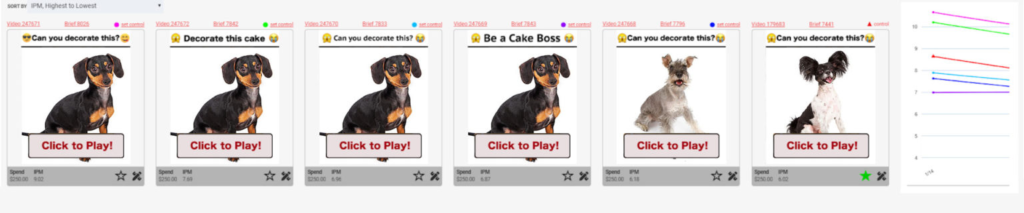
Third A/A test of video creative
Next, we tested six videos: one control and five visually similar variations to the control but one very different from a human. IPMs ranged between 5-10. IPMs for each ad in the far right of the image.

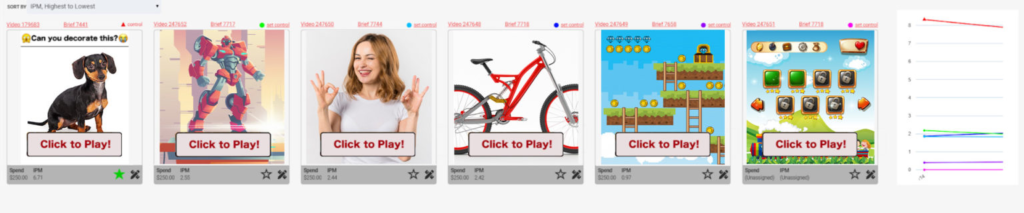
Fourth A/A test of video creative
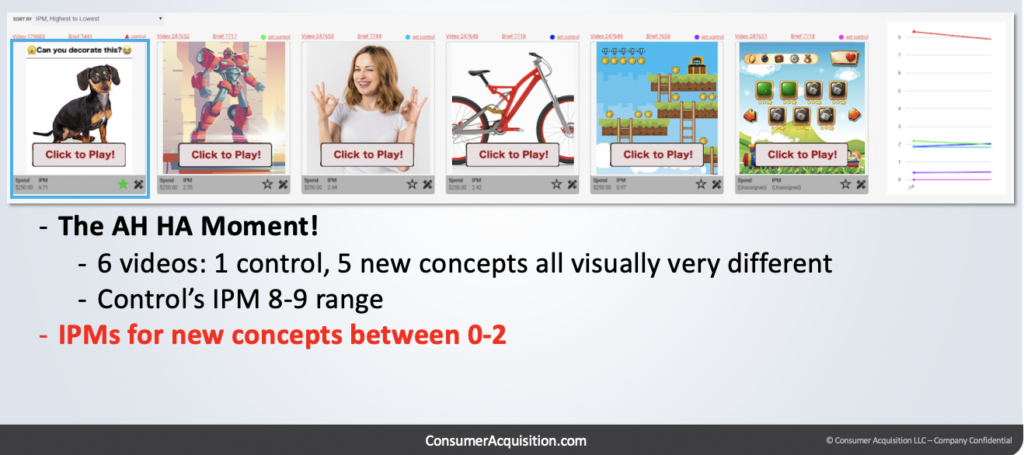
This was when we had our “ah-ha!” moment. We tested six very different video concepts: the one control video and five brand new ideas, all of which were visually very different from the control video and did not share the same thumbnail.
The control’s IPM was consistent in the 8-9 range, but the IPMs for the new visual concepts ranged between 0-2. IPMs for each ad in the far right of the image.
Here are our impressions from the above tests:
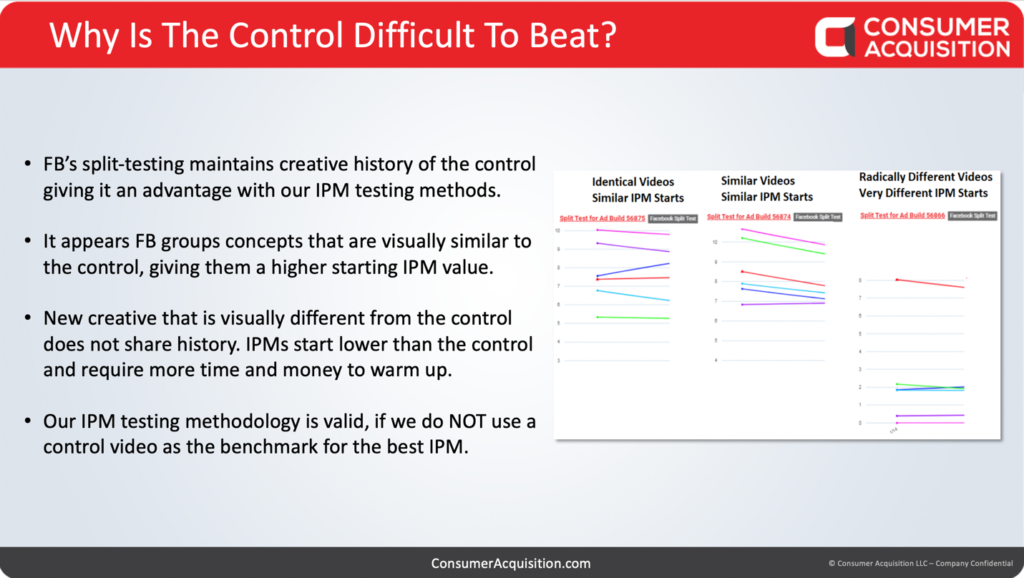
Facebook’s split-tests maintains creative history for the control video. This gives the control advantage with our non-statistically relevant, non-standard best practice of IPM testing.
We are unclear if Facebook can group variations with a similar look and feel to the control. If it can, similar-looking ads could also start with a higher IPM based on influence from the control — or perhaps similar thumbnails influence non-statistically relevant IPM.
Creative concepts that are visually very different from the control appear to not share a creative history. IPMs for these variations are independent of the control.
It appears that new, “out of the box” visual concepts vs the control may require more impressions to quantify their performance.
Our IPM testing methodology appears to be valid if we do NOT use a control video as the benchmark for winning.
IMP Testing Summary
1. During our testing, we noticed that Facebook maintains creative history for the current video winner during an A/B test. This makes the control video very difficult to beat when using our IPM testing methodology.
2. Ads that are visually like the control appear to be grouped together in terms of how the algorithm treats them. They are also automatically given a higher IPM (impressions per thousand) value, even at the very start of a test.
3. Any new creative that is visually very different from the control does not share this creative history. This “very different creative” will start the test with a lower IPM. Because of this, any creative that is visually very different from the control will require more time and money to “warm-up” its creative history. It will also require more time and money to get out of the learning phase and into the optimized phase before it ever has a chance of competing against the control.
Here’s what this all looks like in terms of the performance of different ads:
If the split-testing did not maintain creative history, the starting value for IPMs would be much closer. But as you can see in the chart above, this is not what our tests show is happening.
This feature causes test results like the one below, where we have set up a brand new test with an existing control, and right at the start, the control is granted an IPM around 8-9, but all the other (visually very different) ads get IPMs around 0-2.
Interesting, eh?
This discovery forced us to retest a lot of creative and re-think our testing methodologies. The good news is that after re-testing a lot of our old creative, 95% of the newly retested creative that had previously failed to beat the control, actually improved its performance to an 85% failure rate (as opposed to the 95% failure rate all that creative had had before). This all resulted in a 29% lift in ROAS thanks to our new approach to testing, which takes into account the “creative history” factor in Facebook’s testing algorithm.
It took us a lot of work… but ultimately, we got a 29% lift in ROAS.
So how can you work with creative history being maintained? Watch our video for the step by step process, but basically, don’t use a control video as the benchmark for testing new creative. Don’t put your control inside the split-test of your new creative concepts. Instead, run all your new creative concepts against each other – without the control. Then let these “challenger” videos build up enough learning to effectively compete with the control “champion video.”
Creative Testing 2.0
Given the above results, those of us testing using IPM have an opportunity to re-test IPM winners that exclude the control video to determine if we have been killing potential winners. As such, we recommend the following four-phase testing plan.
- Low-cost IPM-based engagement test
- Competitive ROI-focused campaign
- Phase 2 winners in new adset introduced in production campaigns without head-to-head competition against control video
- Rollout
Phase 1: Initial IPM Test
- Create a new split test campaign using 3~6 new creatives (no control).
- Setup campaign structure for basic App Install (No event optimization or value optimization)
- Spend an equal amount on each creative. Ex: One ad per adset.
- Budget for at least 100 installs per creative
- $200~$400 spend per ad is recommended (based on a CPI of $2-$4) if T1 English-speaking country
- $20~$40 spend per ad/adset testing in India (based on $0.20-$0.40 CPI)
- US Phase 1 testing.
- 10-15% LAL with a seed audience similar to past 90-day installers, or past 90-day payers.
- Non-US Phase 1 testing.
- Use broad targeting & English speakers only
- If not available in India, try other English-speaking countries with lower CPMs than U.S. and similar results. Ex: ZA, CA, IE, AU, PH, etc.
- Use the OS (iOS or Android) you intend to scale in production
- Use one body text
- Headline is optional
- FB Newsfeed placement only
- Be sure winner has 100+ installs (50 installs acceptable in high CPI scenarios)
- 100 installs: 70% confidence with 5% margin of error
- 160 installs: 80% confidence with 5% margin of error
- 270 installs: 90% confidence with 5% margin of error
- At the conclusion of the test, move top 2 IPM creatives to a Phase 2 test
Phase 2: Initial ROAS Test
- Create a new campaign with AEO or VO optimization
- Place all creatives into a single adset
- Use 2-6 IPM winner creatives from Phase 1 tests (you can combine winners from multiple Phase 1 tests into a single Phase 2 test)
- OS – Android/iOS. 5-10% LALs from top seeds (purchases, frequent users + purchase) + Auto Placements
- Testing can be done at a lower cost if you wish to run this campaign in other countries where ROAS is similar or higher but CPMs are much lower compared to US – ie. South Africa, Ireland, Canada, etc.
- Lifetime budget $1,000-$3,000 or daily budgets of $500-$750 over the course of 4-6 days
Phase 3: ROAS Scale Test
- Choose ROAS winners from Phase 2 testing
- Starting with a good-strong performing CBO campaign, create a copy of an existing adset, delete the existing old ads, and replace with your Phase 2 winner. This will allow the new ads to spend while in a competitive environment. Use CBO, create new ad set and roll them out towards the target audiences that produce good results for control
- Let CBO control budget between ad sets with control creatives and ad sets with new creative winners. Intervene with adset min/max spend control only if the new creatives in the new adset don’t receive spend from CBO.
Phase 4: Rollout
- Phase 3 ads that are successful with high KPI compared to the control get rolled out into all existing adsets/campaigns.
We look forward to hearing how you’re testing and sharing more of what we uncover soon.
Conclusion
Once you understand how the social advertising platforms, Facebook and Google, are changing their AI and tools, and you understand the power of testing, it’s clear: CREATIVE IS KING.
So you know creative is the best path to high ROAS. Creative trends allow you to effectively steal ideas from competitors. Player profiles extend the audience and performance of your ads, while enhanced creative testing saves time and money.
These elements should all be shaping your creative strategy. You know all this requires a lot of testing – and efficient testing, at that – to surface the high-performance creative you need to keep your campaigns alive.
We’ve gotten to know it well after performing more than 10,000 A/B and multivariate tests on Facebook and its competitor, Google. We produce more than 100,000 video and image ads every year. We have managed over $3 billion in paid social ad spend.
Hopefully, the learnings from our work have helped you understand the landscape and the trends rising in “Creative Strategy 2.0” and “Creative Testing 2.0”.
If you’d like to learn more about our creative testing system, and what we’ve learned about Facebook’s testing algorithm, check out our fun explainer video or read our white paper on the subject.